
Если выбирать BI из Superset и DataLens (облако или open source), чтобы Вы предпочли для внедрения?
Final Results
26%
Apache Superset
25%
Yandex DataLens
49%
Посмотреть результаты
🤡2😁1
Forwarded from Data Coffee
107 (S4E12). dbt, Ubuntu & Greenplum
Ведущие подкаста Data Coffee🎧 обсуждают новости и делятся своими мыслями!
Обсудили:
• новые чипы M3💻
• dbt & Data Vault🔒
• Greenplum7️⃣
• отличия в версиях Ubuntu🆓
• и другое
Сайт: https://datacoffee.link
Telegram: https://www.tg-me.com/datacoffee
Mastodon: https://techhub.social/@datacoffee
Чат подкаста: https://www.tg-me.com/datacoffee_chat
#datacoffee #data #podcast #данные #подкаст #кофе #coffee
Где слушать🎧:
— Бот-плеер
— RSS feed
— YouTube
— Остальные площадки
❤1
Прикольная утилита GUI-based Python code generator, которая поможет с разными задачами по анализу и визуализации данных.
Выбираете тип задачи, вбиваете параметры и получаете готовый код) Можно прикрутить к Google Colab.
Пока вроде бесплатная 🙂
Сайт: https://visualpython.ai/
Гитхаб: https://github.com/visualpython/visualpython
Выбираете тип задачи, вбиваете параметры и получаете готовый код) Можно прикрутить к Google Colab.
Пока вроде бесплатная 🙂
Сайт: https://visualpython.ai/
Гитхаб: https://github.com/visualpython/visualpython
Forwarded from Визуализируй это!
Смотрите, какую интересную штуку нашла!
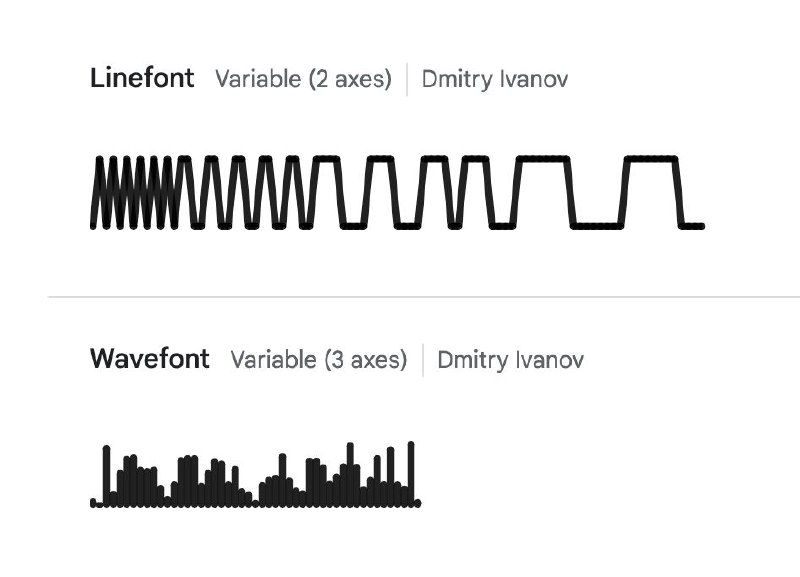
Это шрифты, которые выглядят как линейный график или столбчатая диаграмма.
Каждый символ закодирован определённым числом:
- Цифры 0..9 — это значения 0..90 с шагом 10.
- Буквы a..zA..Z — значения 0..100 с шагом 2.
- Юникод символы (U+0100..U+017F) — значения 0…127 с шагом 1.
Можно скачать с Google Fonts:
1. Linefont
2. Wavefont
Идеально для простеньких спарклайнов.
Rill open source
Rill is the fastest path from data lake to dashboard. Download Rill to start modeling data and create fast, exploratory dashboards.
BI as code
https://github.com/rilldata/rill
Rill is the fastest path from data lake to dashboard. Download Rill to start modeling data and create fast, exploratory dashboards.
BI as code
https://github.com/rilldata/rill
GitHub
GitHub - rilldata/rill: Rill is a tool for effortlessly transforming data sets into powerful, opinionated dashboards using SQL.…
Rill is a tool for effortlessly transforming data sets into powerful, opinionated dashboards using SQL. BI-as-code. - rilldata/rill
🔥2
GUI от сторонних разработчиков для доступа к ClickHouse | ClickHouse Docs
https://clickhouse.com/docs/ru/interfaces/third-party/gui
https://clickhouse.com/docs/ru/interfaces/third-party/gui
Clickhouse
Визуальные Интерфейсы от Сторонних Разработчиков | ClickHouse Docs
Список сторонних GUI инструментов и приложений для работы с ClickHouse
SQL принципы для создания датасетов
Также от себя лично рекомендую курсы Глеба на Stepik 💪
https://youtu.be/rltY3lTuq10?si=9vMPTxgOiiUMY4Jo
Также от себя лично рекомендую курсы Глеба на Stepik 💪
https://youtu.be/rltY3lTuq10?si=9vMPTxgOiiUMY4Jo
YouTube
SQL-принципы для создания датасетов
Ноутбук: https://colab.research.google.com/drive/1iWeDAOH1gmMi0RW4okSe_tY7IT2scAH2?usp=sharing
Глеб Михайлов - анализ данных.
★Анализ данных, дата саенс, python, SQL.
★Делюсь практическими наработками и лайфхаками.
★Занимаюсь анализом данных с 2011 года…
Глеб Михайлов - анализ данных.
★Анализ данных, дата саенс, python, SQL.
★Делюсь практическими наработками и лайфхаками.
★Занимаюсь анализом данных с 2011 года…
👍2
Заметки про ClickHouse
https://ivan-shamaev.ru/clickhouse-101-course-on-learn-clickhouse-com/
https://ivan-shamaev.ru/clickhouse-101-course-on-learn-clickhouse-com/
Персональный блог Data Engineer | Ex-TeamLead BI Developer
Заметки про ClickHouse. Tutorial 101 - Большая подборка информации
Заметки про ClickHouse. Tutorial 101 - Большая подборка информации. Учебник, Обучение, Лекции по КликХаус колоночной базе данных. Туториал
Microsoft Power BI дашборд по зп проектных менеджеров
https://app.powerbi.com/view?r=eyJrIjoiMzc0NjEyM2ItOTljOC00ZjgzLWE4NGItNTQ5ODg4NTQ4ODMwIiwidCI6ImIwNmZmNTliLTJhMjMtNGI2YS1iYzM3LTMyOTdiMTcyOGQ4MyIsImMiOjl9
https://app.powerbi.com/view?r=eyJrIjoiMzc0NjEyM2ItOTljOC00ZjgzLWE4NGItNTQ5ODg4NTQ4ODMwIiwidCI6ImIwNmZmNTliLTJhMjMtNGI2YS1iYzM3LTMyOTdiMTcyOGQ4MyIsImMiOjl9
Как данные физически хранятся в таблице MergeTree() в ClickHouse?
https://ivan-shamaev.ru/how-data-is-storing-in-mergetree-table-in-clickhouse-physically/
https://ivan-shamaev.ru/how-data-is-storing-in-mergetree-table-in-clickhouse-physically/
Персональный блог Data Engineer | Ex-TeamLead BI Developer
Как данные физически хранятся в таблице MergeTree() в ClickHouse?
Исследование как данные физически хранятся в таблице MergeTree() в ClickHouse, как происходит запись parts, partitions и где лежат индексы
Курс Машинное обучение с видео на YouTube
Этот курс научит вас использовать самые распространенные инструменты для анализа данных и машинного обучения. После освоения данного курса вы научитесь применять классические модели регрессии и классификации, писать код для обучения и тестирования моделей, вести проекты в области построения интеллектуальных систем.
https://koroteev.site/ml/
Михаил Коротеев
Машинное обучение
Роман Бунин — Dashboard Map: фреймворк для разработки системы отчетности
Для того, чтобы в компании не создавались дашборды на каждый чих, необходимо использовать структурированные подходы к проектированию системы отчетов. Если вам знакомы такие проблемы, как «невозможно найти, в каком отчете какая метрика», «расчеты между отчетами не сходятся», «а давайте сделаем еще один дашобрд», то этот доклад поможет вам их избежать.
https://www.youtube.com/watch?v=mSe01NAadIQ
Презентация 1 - https://miro.com/app/board/o9J_kpOMVFA=/
Презентация 2 - https://squidex.jugru.team/api/assets/srm/26f02e26-2a41-4555-945a-8287e2e559d2/bunin-dashboard-map.pdf
YouTube
Роман Бунин — Dashboard Map: фреймворк для разработки системы отчетности
Подробнее о конференции Flow: https://jrg.su/CAm5kF
— —
Для того, чтобы в компании не создавались дашборды на каждый чих, необходимо использовать структурированные подходы к проектированию системы отчетов. Если вам знакомы такие проблемы, как «невозможно…
— —
Для того, чтобы в компании не создавались дашборды на каждый чих, необходимо использовать структурированные подходы к проектированию системы отчетов. Если вам знакомы такие проблемы, как «невозможно…
👍2❤1🤮1
This media is not supported in your browser
VIEW IN TELEGRAM
Прикольная фича, ссылка на исходный пост в linkedin ниже
😍2
Какое смелое заявление 😄🙈 Но инструмент TaiPy симпотный, с лицензией Apache и на Python. На гитхабе 17 тыщ звездочек
👋🏻Goodbye Power BI! 📊 In 2025 Build AI/ML Dashboards Entirely Within Python 🤖 - DEV Community
https://dev.to/taipy/goodbye-power-bi-in-2025-build-aiml-dashboards-entirely-within-python-4l22
Сайт самого инструмента https://www.taipy.io/
👋🏻Goodbye Power BI! 📊 In 2025 Build AI/ML Dashboards Entirely Within Python 🤖 - DEV Community
https://dev.to/taipy/goodbye-power-bi-in-2025-build-aiml-dashboards-entirely-within-python-4l22
Сайт самого инструмента https://www.taipy.io/
DEV Community
👋🏻Goodbye Power BI! 📊 In 2025 Build AI/ML Dashboards Entirely Within Python 🤖
TL;DR The rise of data-driven decision-making has pushed businesses to adopt tools to...
🔥4